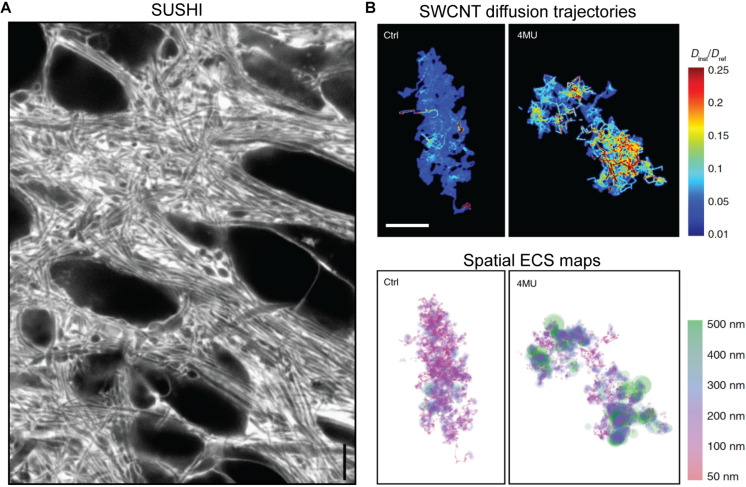
FIGURE 6.
(A) Super-resolution shadow imaging (SUSHI) of the neuropil in cultured hippocampal slice. During perfusion of the slice with a fluorophore in solution, the interstitial fluid becomes brightly fluorescent, while cellular structures appear as dark shadows. As it is based on 3D-STED microscopy as the underlying imaging technique, it offers 50 nm planar resolution, which is sufficient to optically resolve the majority of ECS geometries in the frame. Scale bar is 4 μm. Modified from Figure 1E in Tønnesen et al. (2018), with permission. (B) Super-resolved maps of single-walled carbon nanotube diffusion trajectories (top) and corresponding ECS maps (bottom) in acute rat brain slices, with calibration bars indicating diffusional accesibility for SWCNTs in the ECS and derived ECS dimensions. The left panels are from control animals, while the right ones are from hyaluronan-depleted animals that were chronically administered 4-methylumbelliferone (4MU; a hyaluronan synthase inhibitior) prior to the experiment. Scale bar is 2 μm. From Soria et al. (2020), Nature Communications (scale bar inserted from cropped panel in the original figure), with permission (http://creativecommons.org/licenses/by/4.0/).

