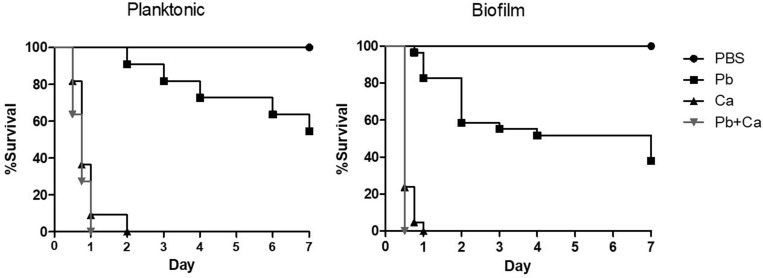
FIGURE 6.
Survival curve of Galleria mellonella larvae infected with 1 × 10⁶ cells/larvae of planktonic cells, mono-, and dual-species biofilms grown after P. brasiliensis (Pb) was added to preformed C. albicans (Ca) biofilms. Larvae inoculated with PBS was used as control. The values are plotted as Kaplan–Meier survival curves and compared using log-rank tests.

