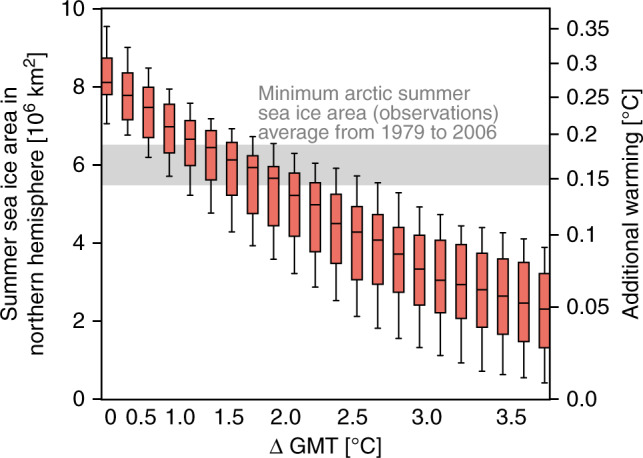
Fig. 4. Additional warming due to meltdown of Arctic summer sea ice.

Box whiskers plot of global mean temperature (ΔGMT) versus Arctic summer sea ice area with error boxes (error bars) representing the interquartile range (full spread) of the ensemble at the according GMT over the CLIMBER-2 ensemble runs. The additional warming when the Arctic summer sea ice disappears is represented by a second y-axis computed via a least-square fit from the corresponding summer sea ice area. The relationship between summer sea ice area and additional warming is slightly nonlinear. This means that a doubling of the ice area does not quite translate into a doubling of the additional warming. The x-axis shows ΔGMT above pre-industrial computed via a GMT-CO2 concentration least-square fit. The shaded area shows the mean Arctic sea ice area as observed by NERSC (Nansen Environmental & Remote Sensing Center) from 1979 to 2006, where the uncertainty indicates one standard deviation: 6.0 ± 0.5 × 10⁶ km2.
