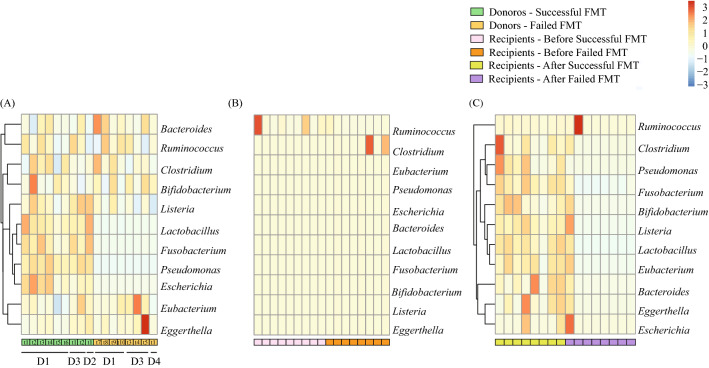
Figure 4.
Bile acid metabolizers of FMT donors and recipients. Heatmap of bile acid metabolizers of (A) donors (D1-D4), (B) recipients pre-FMT, and (C) recipients post-FMT for successful and failed FMT outcomes. The dendrogram shows clustering based on the relative abundances. The heatmap color (blue to red, corresponding to low to high) represents the row z-score of the relative abundance values. Each sub-block under heatmaps represent a different time point for the corresponding donor.

