Figure 5.
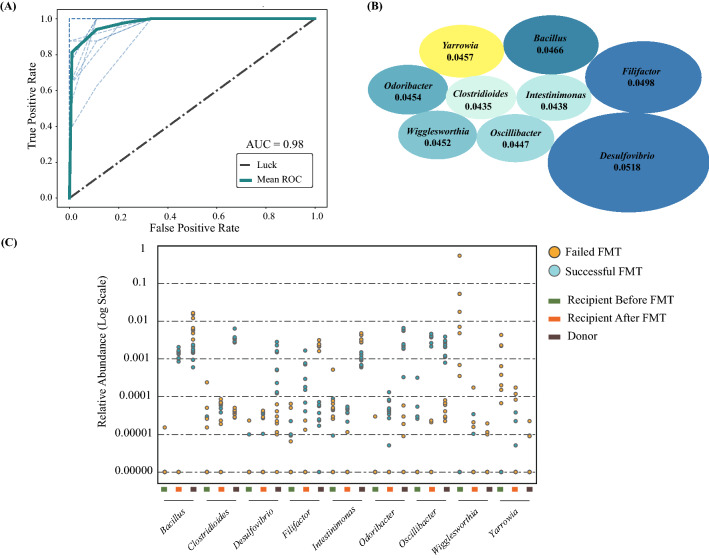
Machine learning model predicting FMT outcome. The random forest model utilized led to (A) the ROC curve displaying an AUC of 98%, (B) the top 9 most important microbes (blue ellipses represent bacteria; yellow ellipse represent fungi) involved in FMT success prediction where the size of the ellipses represents the feature importance magnitudes (average Mean Decrease in Impurity), and (C) the relative abundance (shown on logarithmic scale) for the top 9 features of donor, and recipient samples pre- and post-FMT.

