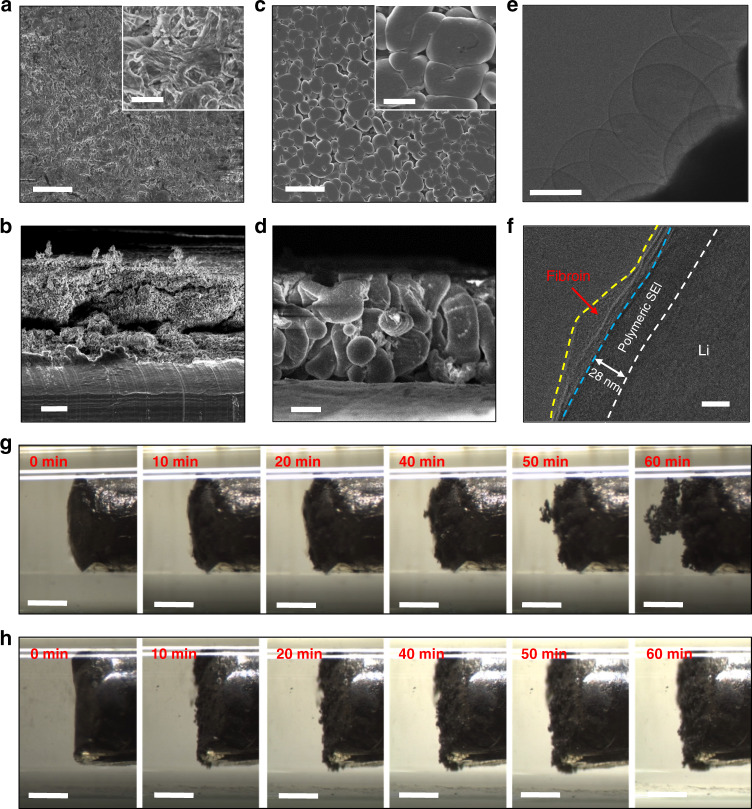
Fig. 2. Characterization of Li deposition in ether-based electrolyte with fibroin additive.
a, b Top-view (a) and cross-section (b) SEM images of Li metal anodes cycling in the cells with blank (i.e. no fibroin) electrolyte. c, d Top-view (c) and cross-section (d) SEM images of Li metal anodes cycling in the cells with fibroin additive in the electrolyte. The insets in (a) and (b) are the corresponding high-magnification SEM images. Scale bars, (a–d) 20 µm and inserts in (a, c) 5 µm. e, f Low-resolution (e) and high-resolution (f) cryo-EM images of Li deposit in the ether-based electrolyte with fibroin. Scale bars, (e) 1 µm and (f) 20 nm. The white line delineates the boundary between metallic Li and SEI. The blue line delineates the boundary between adsorbed fibroin and SEI. The yellow line delineates the boundary between adsorbed fibroin and electrolyte. g, h In situ observations of Li deposition behavior in the glass capillaries filled with the blank electrolyte (g) and the electrolyte with fibroin (h) at a current density of 3 mA cm−2. Scale bars, (g, h) 500 µm.

