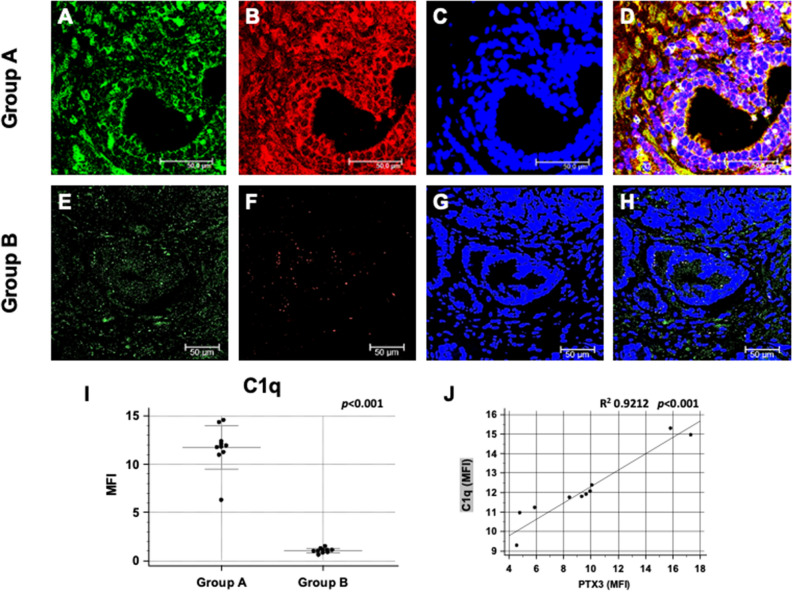
Figure 2.
Complement factor C1q deposition and co-localization with PTX3 in first PBx of patients subsequently developing prostate cancer (group A) or not (group B). PTX3 protein expression (green; A and E) and C1q deposition (red; B and F) were evaluated in the first PBx by double label immunofluorescence and confocal microscopy as detailed in Materials and Methods. TO-PRO-3 was used to stain nuclei (blue; C and G). Merged images (D and H) demonstrate the co-localization of the two protein signals (yellow). Mean fluorescence intensity (MFI) quantification confirmed a statistically significant higher C1q deposition in group A compared to group B (I). Bar length = 50 µ; (J) significant correlation of PTX3 and C1q deposits in group A.

