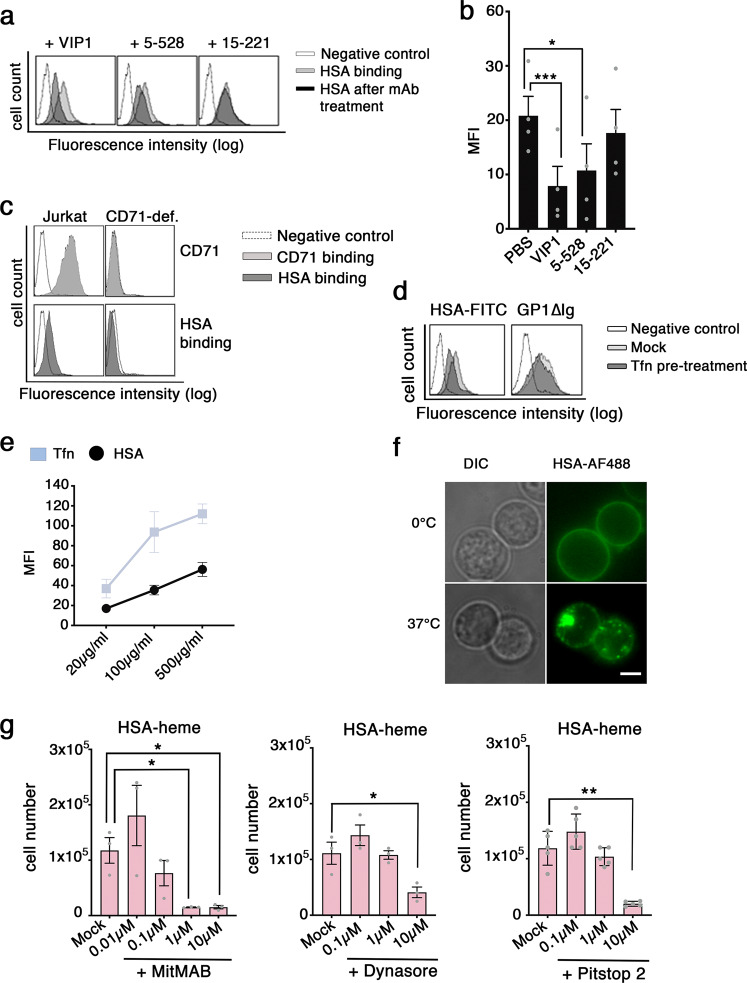
Fig. 3. HSA-heme uptake is mediated by endocytosis.
a Effect of CD71 mAbs on HSA binding to CD71. Binding of FITC-labeled HSA (100 µg/ml) to CD71 was analyzed by flow cytometry. Jurkat T cells were pre-treated with or without CD71 mAb VIP1, 5-528, or 15-221. b Bar graph shows the mean fluorescence intensity (MFI) of HSA binding to CD71. Data shown are representative of four independent experiments. c Analysis of the binding of HSA-FITC to CD71 in Jurkat T cells and Jurkat T cells, which lack CD71 surface expression due to mAb-induced down-modulation. Fluorescence was measured by flow cytometry. Data presented is representative of three independent experiments. d FACS analysis of the binding and blocking of HSA and GP1∆Ig protein to CD71. Jurkat T cells were pre-treated with transferrin and incubated with FITC-labeled HSA (200 µg/ml) or GP1∆Ig (6 µg/ml) protein, followed by a second step staining with a secondary antibody. Data shown is representative for four independent experiments. e FACS analysis of the internalization of HSA-FITC and Tfn-FITC at 37 °C (n = 4). f HSA internalization was visualized by Epifluorescence microscopy on live cells. The uptake (37 °C) and binding (0 °C) of AF488-labeled HSA was assessed. Differential interference contrast (DIC) and fluorescence micrographs are shown. Results represent one of three independent experiments. Scale bar: 5 µm. g Jurkat T cells were cultivated in HSA-heme at a concentration of 200 µg/ml. In comparison to the control (Mock), cells were additionally treated with inhibitors MiTMAB (n = 3), Dynasore (n = 3), or Pitstop 2 (n = 5) at different concentrations. b, g Data show mean ± SEM. P values were calculated by using one-way ANOVA, followed by Tukey’s multiple comparison test. *P < 0.05, **P > 0.01, and ***P < 0.001.

