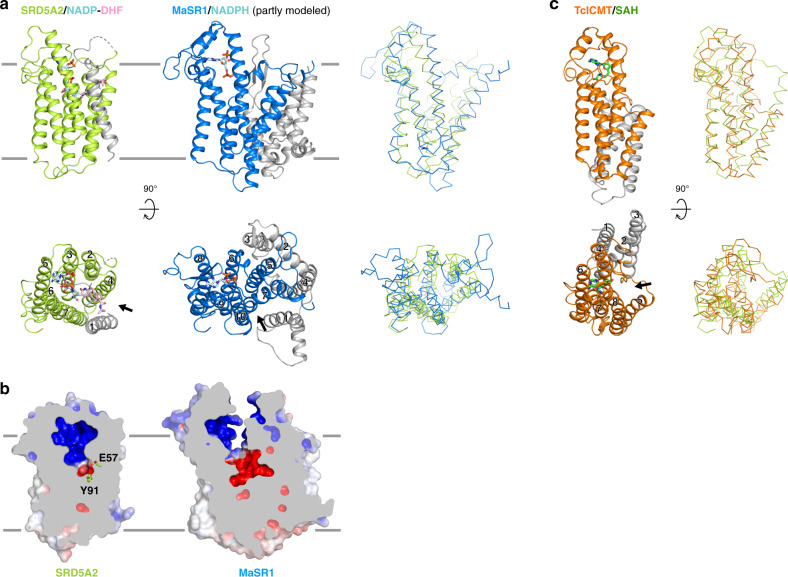
Fig. 6. Structural comparison of SRD5A2 with MaSR1 and ICMT.
a Structural comparison of the transmembrane regions of SRD5A2 and MaSR1 (PDB ID: 4QUV). The core transmembrane regions in SRD5A2 and MaSR1 that can be structurally aligned are shown as colored ribbons, while the rest parts are shown as gray ribbons. The right panel shows the superimposition of SRD5A2 and MaSR1. b Occluded and exposed ligand-binding cavities in SRD5A2 and MaSR1, respectively. c Structural comparison of the transmembrane regions of SRD5A2 and ICMT (PDB ID: 5V7P). The core transmembrane region of ICMT that can be well aligned to SRD5A2 is colored orange. The cofactor of ICMT, SAH, is colored green. The right panel shows the superimposition of SRD5A2 and ICMT. The potential substrate entry ports in all three enzymes are indicated by arrows.

