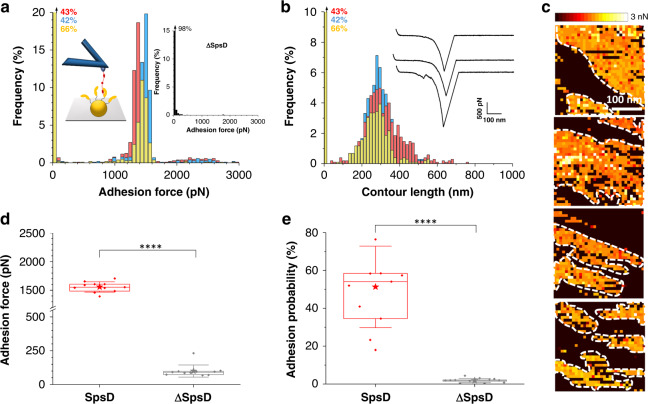
Fig. 2. Imaging and functional analysis of single SpsD adhesins on living bacteria.
Maximum adhesion force (a) and contour length (b) histograms obtained by recording force–distance curves in PBS between three different S. pseudintermedius ED99 SpsD cells and AFM tips functionalized with Fg, at a retraction velocity of 1000 nm s−1 (total number of curves from 3 cells n = 1378). Insets in (a) show a scheme of the setup and the adhesion force histogram obtained on ΔSpsD cells (3 cells merged). Inset in (b) shows representative retraction force profiles for SpsD cells. (c) Adhesion maps obtained on SpsD cells highlighting the clustering phenomenon (white dotted lines). (d, e) Box plots of the mean adhesion forces (d) and the mean adhesion probabilities (e) obtained for 11 cells from 5 independent cultures. Mean adhesion forces were estimated from the sharp peaks (range of 1100–2300 pN) shown in (b). Stars are the mean values, lines the medians, boxes the 25–75% quartiles and whiskers the SD. Student t-test: ****p ≤ 0.0001.

