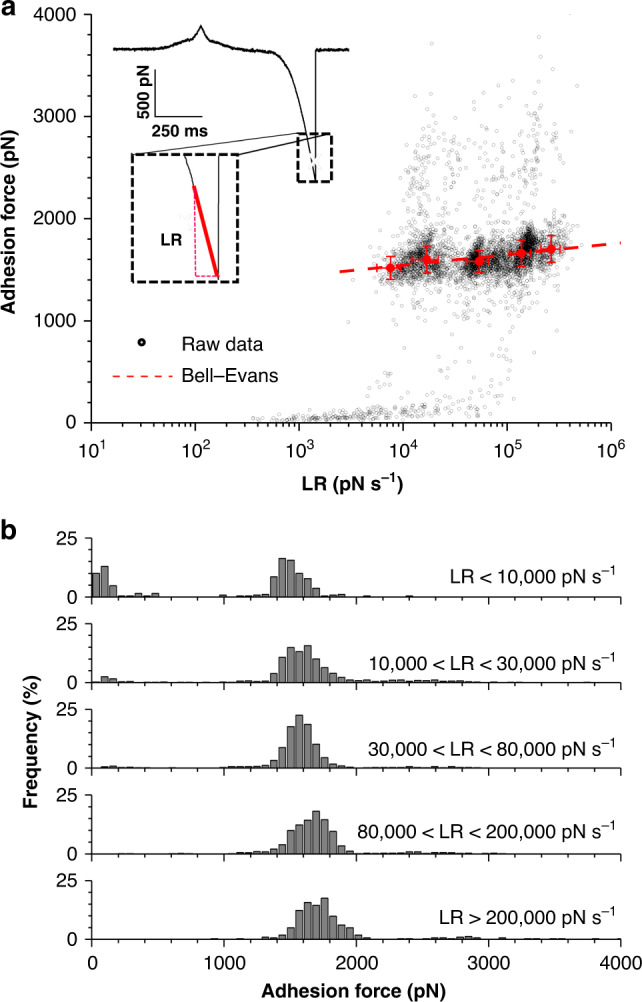
Fig. 3. Binding of SpsD to fibrinogen is enhanced by tensile force.

(a) Dynamic force spectroscopy plot obtained by recording force–distance curves in PBS between Fg-tips and S. pseudintermedius ED99 SpsD cells (n = 4326 data points from 4 cells). Inset shows a representative force vs time curve, highlighting the way the loading rate (LR) is extracted. A Bell Evans model fit (dashed red line) through the most-probable rupture force and force LR shows the expected force loading-rate dependency of the force (xβ = 0.090 nm koff = 5.07 × 10⁻¹³ s−1). (b) Corresponding rupture force histograms as a function of discrete ranges of LRs, emphasizing the shift toward higher forces with increasing LRs.
