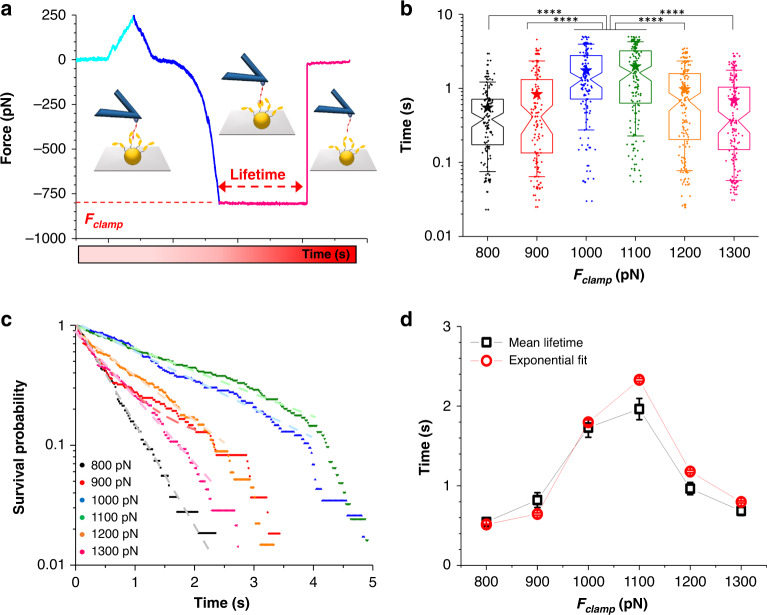
Fig. 4. The DLL-interaction between SpsD and fibrinogen involves a catch-slip bond transition.
(a) Characteristic force–clamp curve (force vs time) along with illustrations of the setup at different steps of the clamp process. Cyan stands for the approach, blue for the retraction, and pink for the clamp and spontaneous rupture of the SpsD-fibrinogen bond. The bond lifetimes is given by the constant force regime in red. (b) Box plot (overlapped with data, n = 108, 109, 116, 124, 135, and 140 for Fclamp = 800, 900, 1000, 1100, 1200, 1300 pN, respectively, recorded on 11 cells from 6 independent cultures) of the lifetimes extracted from the force vs time curves at a retraction velocity of 1000 nm s−1. Stars are the mean values, boxes the 25–75% quartiles and whiskers the 10–90% interval. Kruskal–Wallis test followed by Dunn’s multiple-comparison test: ****p ≤ 0.0001. (c) Bond survival probabilities for the SpsD–Fg interactions, measured at six different clamping forces. Fits are presented as dashed lines with corresponding colors. (d) Force-dependent bond lifetimes, extracted from the exponential fit on the survival plot and the average lifetimes from the box plot, at a retraction velocity of 1000 nm s−1, exhibit a catch-slip transition. For average lifetimes, error bars represent the standard deviation from n = 108, 109, 116, 124, 135, and 140 data points for Fclamp = 800, 900, 1000, 1100, 1200, 1300 pN, respectively, on 11 cells from 6 independent cultures (as in (b)). For lifetimes extracted from the exponential fit, error bars stand for the standard error of the fit.

