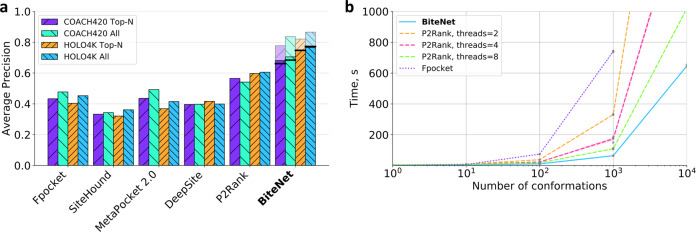
Fig. 6. Predictive power and computational efficiency of BiteNet.
a Performance of the binding site prediction methods on the COACH420 and HOLO4K benchmarks. Violet and orange bars with diagonal hatching correspond to the average precision calculated for top N predictions for the COACH420 and HOLO4K benchmarks, respectively, where N is the number of true binding sites in a protein. Similarly, cyan and blue back hatched bars correspond to the average precision calculated for all predictions for the COACH420 and HOLO4K benchmarks, respectively. Pale bars correspond to the BiteNet performance, when the true positive binding site is defined as in the training. Black lines correspond to the BiteNet performance on the whole benchmarks. b Elapsed time for fpocket (dotted violet line), P2Rank (dashed orange, magenta, and green lines), and BiteNet (solid blue line) to analyze 1, 10, 1000, and 10,000 conformations of a protein with ~2000 atoms. The computed elapsed time is the average of ten independent runs, individual data points are shown with gray circles.

