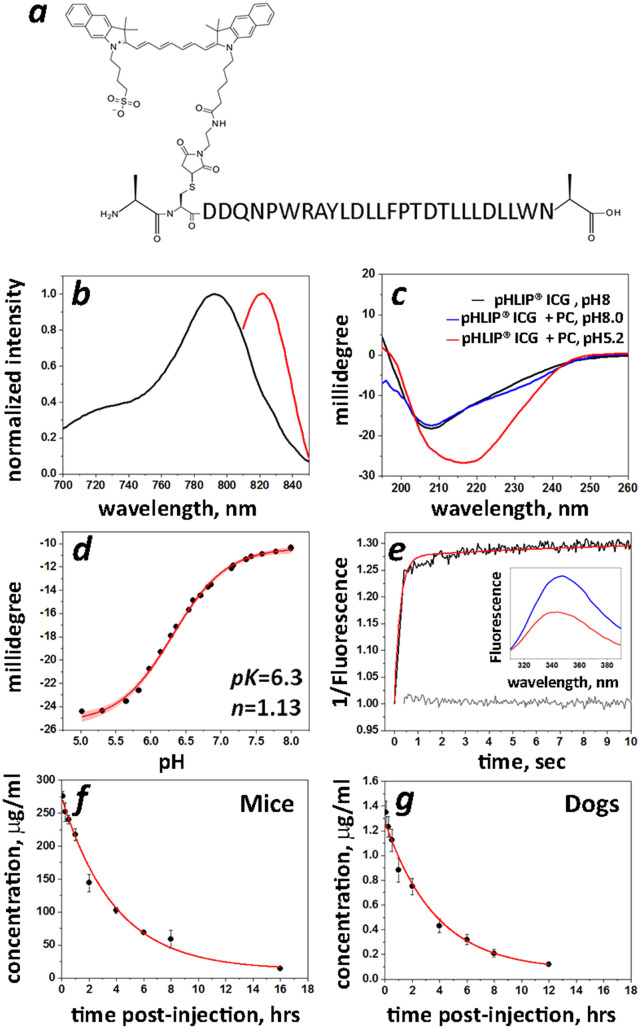
Figure 1.
Characterization of pHLIP ICG and blood clearance in mice and dogs. (a) The Var3 pHLIP sequence is shown with the chemical structure of the ICG dye coupled to a single Cys residue at the N-terminal part of pHLIP peptide. (b) Normalized absorbance (black line) and fluorescence (red line) spectra (the excitation is at 805 nm) of pHLIP ICG (5 µM) measured in DMF. (c) Circular dichroism (CD) spectra of pHLIP ICG measured in phosphate buffer (pH 8) in absence (pHLIP ICG, pH 8—black line) and presence (pHLIP ICG + PC, pH 8—blue line) of POPC liposomes, and in the presence of POPC liposomes at pH 5.2 (pHLIP ICG + PC, pH 5.2—red line) indicate on formation of helical structure in membrane at low pH. (d) pH-dependent insertion of pHLIP ICG into the bilayers of POPC liposomes monitored by changes of the CD spectral signal at 222 nm. The data were fitted with the Henderson-Hasselbach equation (red line with 95% confidence interval) to establish the midpoint of the transition (pK). (e) The kinetics signal (multiplied by − 1) of pHLIP ICG insertion into lipid bilayers of POPC liposomes as a result of a pH drop from pH 8 (blue line in insert) to pH 5 (red line in insert) was monitored in real-time by the tryptophan fluorescence changes (black line). The gray line is a baseline obtained by mixing pHLIP ICG with POPC liposomes at pH 8 with pH 8 buffer. The red line is a bi-exponential fit of the experimental data (85% of the signal changes occur with a rate of 5 s−1 and about 15% of final adjustment is completed at a rate of 0.077 s−1). (f,g) Blood clearance profile and single exponential fitting curves (red lines) obtained from mice (f) and dogs (g) after a single i.v. injection of 12.3 mg/kg of pHLIP ICG to mice and 0.064 mg/kg of pHLIP ICG to dogs are shown.

