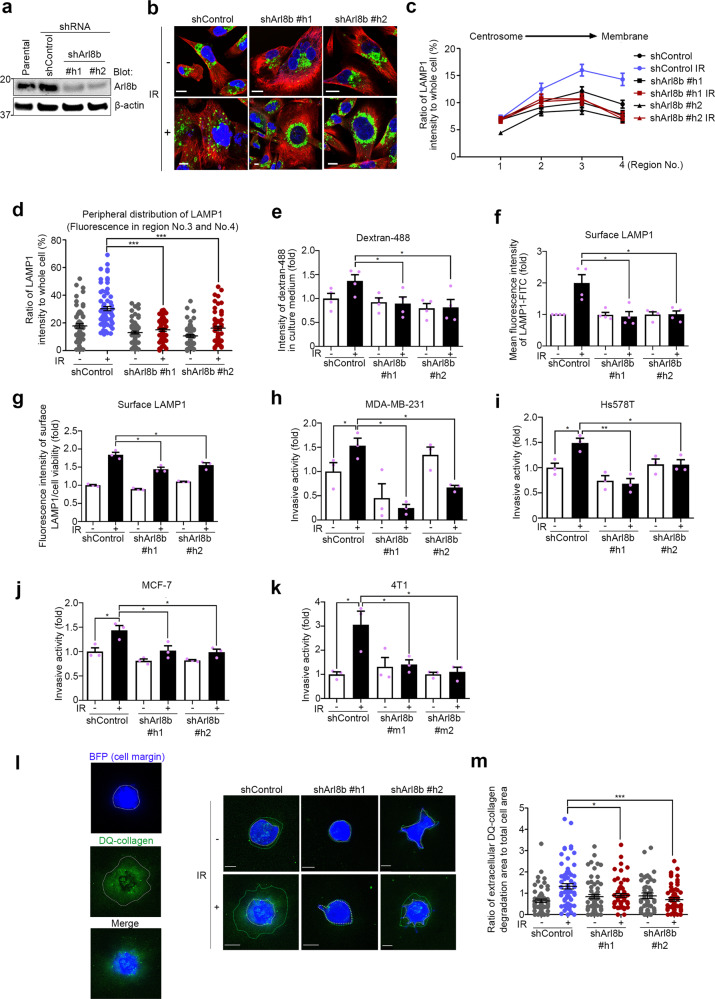
Fig. 4. Arl8b is required for the enhanced lysosomal exocytosis and invasion of IR-S cancer cells.
a Arl8b was knocked down with shRNAs (shArl8b human #1 and #2) in MDA-MB-231 cells. b LAMP1 in control or Arl8b-knockdown MDA-MB-231 cells. Cells were or were not treated with 4 Gy IR. Green, LAMP1; red, α-tubulin; blue, DAPI. Bar, 10 μm. c Quantification of the lysosomal distribution in MDA-MB-231 cells. The intensity of region 0 was excluded. Points and connecting lines, means; bars, SEMs. d Scatter plot of the lysosomal distribution in the cell periphery (regions 3 and 4). Bars, SEMs. e The fluorescence intensities of dextran-488 in the culture medium of control or Arl8b-knockdown MDA-MB-231 cells, with or without IR treatment, were determined with a plate reader. f Surface LAMP1 on control and Arl8b-knockdown MDA-MB-231 cells was detected with flow cytometry. g Surface LAMP1 on control and Arl8b-knockdown MDA-MB-231 cells was detected with an image scanning system. h–k Matrigel chemoinvasion assay of control or Arl8b-knockdown MDA-MB-231 (h), Hs578T (i), MCF-7 (j) and 4T1 (k) cells (shArl8b mouse #1 and #2). l Matrix degradation activity was determined using a mixture of 3D lrECM and DQ-Collagen IV. Control or Arl8b-knockdown Hs578T cells were cultured in 3D lrECM containing DQ-Collagen IV for 48 h after IR. Blue: blue fluorescent protein (BFP) expressed by cells as a marker of cell margins in live-cell imaging. Green: area of DQ-collagen IV cleaved by proteases. m Ratios of extracellular DQ-collagen IV degradation area to the total cell area. Bars, SEMs. All column graphs show the means with SEMs of three (g–k) or four (e, f) independent experiments. The results of each group in column graphs were normalized against that of the control group. *P < 0.05; **P < 0.01; ***P < 0.001.

