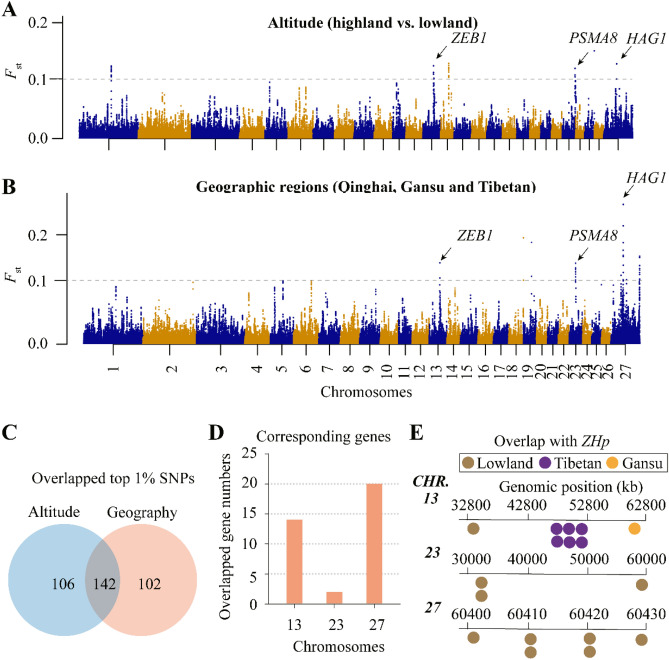
Figure 2.
Manhattan analysis and candidate genes exploration. A-B: Manhattan plot representing Fst values for each SNP across Chromosomes for two subpopulations of altitude and geography. The genomic region with significant Fst values were highlighted in arrows. C: Venn diagram representing overlapped SNPs for two subpopulations of altitude and geography. D: Numbers of corresponding genes harboring overlapped SNPs for two subpopulations of altitude and geography. E: overlapped genes with 1% top values between Fst and ZHp.

