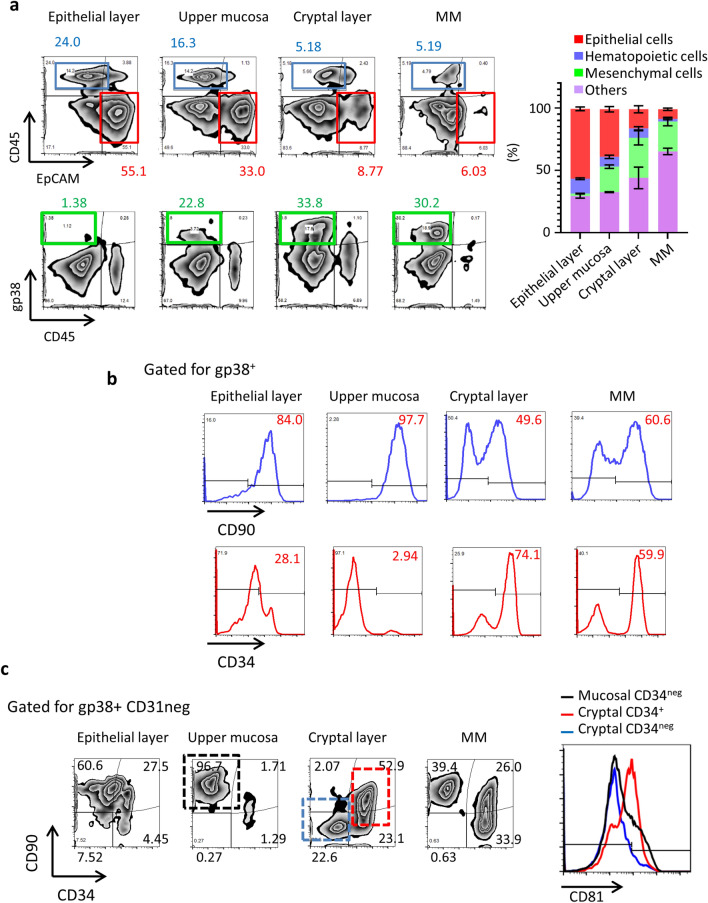
Figure 2.
Cellular profiling of stratified isolated cell populations. (a) Flow cytometry of stratified isolated cells stained with CD45, EpCAM, and gp38. The number indicates percentages of gated populations. Right data indicates the percentages of each cellular component in the colon microenvironment. Data are shown as means ± SEM. (b) Flow cytometry of cells in each layer is shown. The gp38+ cells in the negative-gated areas for EpCAM, TER119, and CD31 are shown. The number indicates the size (percentage) of the gated population. CD90 and CD34 expression of gated gp38+ cells are shown. (c) gp38+ cells were stained with CD90 and CD34. The numbers indicate the size (percentage) of the gated populations. CD81 expressions were shown in the right panel. All data are representative of at least three independent experiments.

