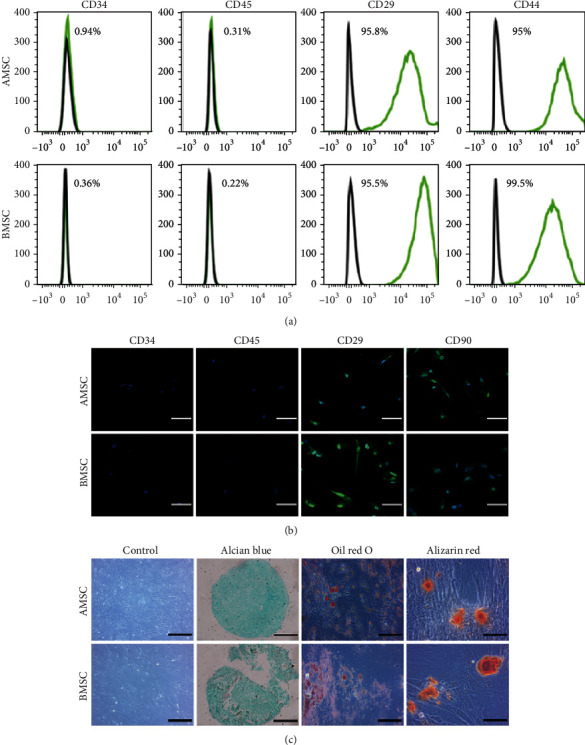
Figure 3.

Identification of AMSCs and BMSCs. (a) Flow cytometric analysis of immunophenotypic profiles of AMSCs and BMSCs. (b) Laser scanning confocal microscopic images of immunofluorescence staining for MSC-specific markers CD29 and CD90 and hematopoietic lineage markers CD34 and CD45. Scale bar = 50 μm. Magnification: ×400. (c) Light micrographs and trilineage differentiation of AMSCs and BMSCs to chondrocytes stained with Alcian Blue, adipocytes stained with Oil Red O, and osteocytes stained with Alizarin Red. Control and Alcian Blue staining: scale bar = 200 μm; magnification: ×200. Oil Red O and Alizarin Red staining: scale bar = 100 μm; magnification: ×400.
