
Figure 2.
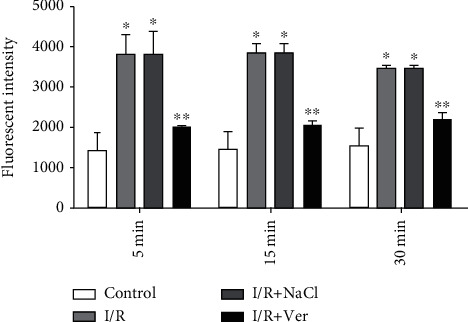
MMP decrease in the prefrontal cortex mitochondria isolated from rats. The data are presented as mean ± SD (n = 6). ∗P < 0.001 vs. control group, ∗∗P < 0.01 vs. I/R+NaCl and I/R groups.
Official websites use .gov
A
.gov website belongs to an official
government organization in the United States.
Secure .gov websites use HTTPS
A lock (
) or https:// means you've safely
connected to the .gov website. Share sensitive
information only on official, secure websites.
MMP decrease in the prefrontal cortex mitochondria isolated from rats. The data are presented as mean ± SD (n = 6). ∗P < 0.001 vs. control group, ∗∗P < 0.01 vs. I/R+NaCl and I/R groups.