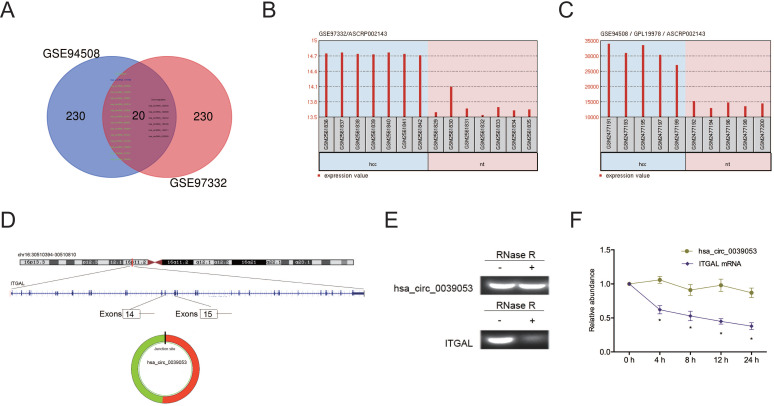
Figure 1.
CircRNA expression profiles in HCC. (A) The Venn diagram overlapping sections show circRNAs that are dysregulated in the two microarray datasets (GSE94508 and GSE97332). (B, C) Hsa_circ_0039053 expression in GSE94508 and GSE97332. (D) Schematic illustration of hsa_circ_0039053. (E) QRT-PCR was utilized to evaluate the resistance of linear ITGAL and hsa_circ_0039053 to RNase R in cells. (F) The stability of hsa_circ_0039053 and ITGAL mRNA in cells was explored by Actinomycin D assay. *P < 0.05.

