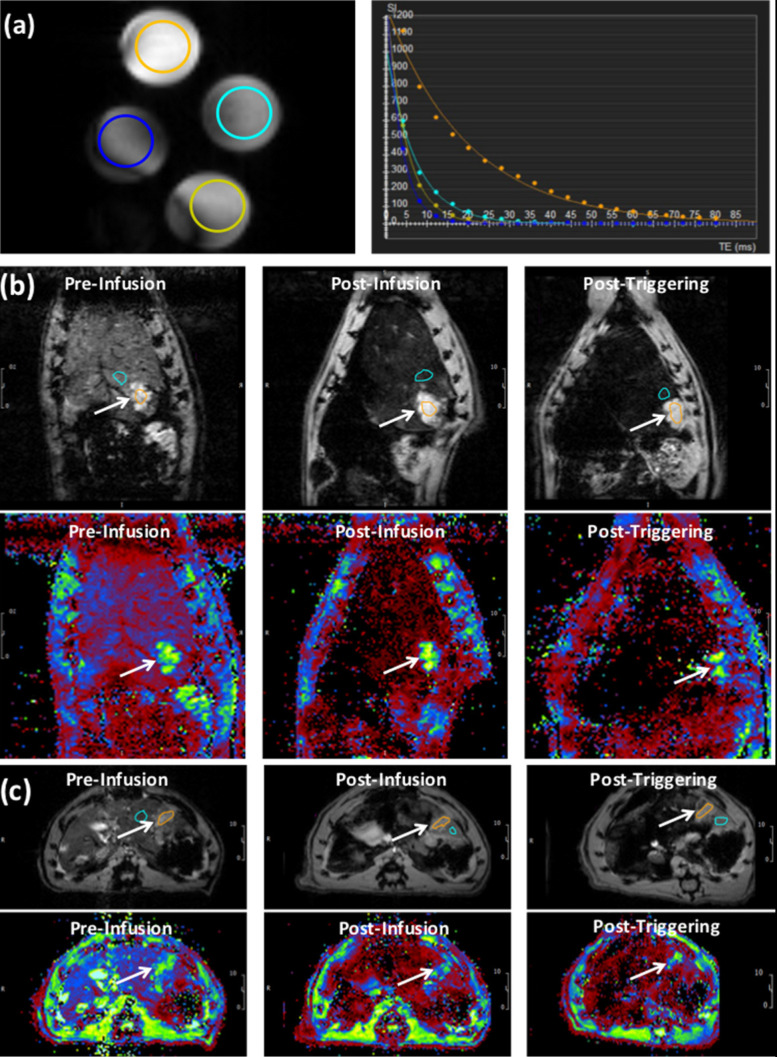
Figure 4.
(a) T2* images showing cross-sections of tubes filled with different concentrations L-NIR-Fe3O4/OX doped in agarose gel. The circles color reflects decreasing signal intensity with increasing iron oxide nanoparticles (IONP) concentration, as shown on the right by the exponential fitting of the T2* versus IONP concentration. (b) Images (top) and T2* maps (bottom) of a coronal slice in a rat showing signal loss with liposome delivery (Fe) deposition in tumor region (arrows; post-infusion vs pre-infusion) and a further loss in signal with AMF post-triggering. (c) Similar results as in (b) but from an axial slice from a different rat. T2* color map (in ms) is shown in the bottom. Orange circle reflects tumor region and blue circles represent the respective regions using which normalization was performed.

