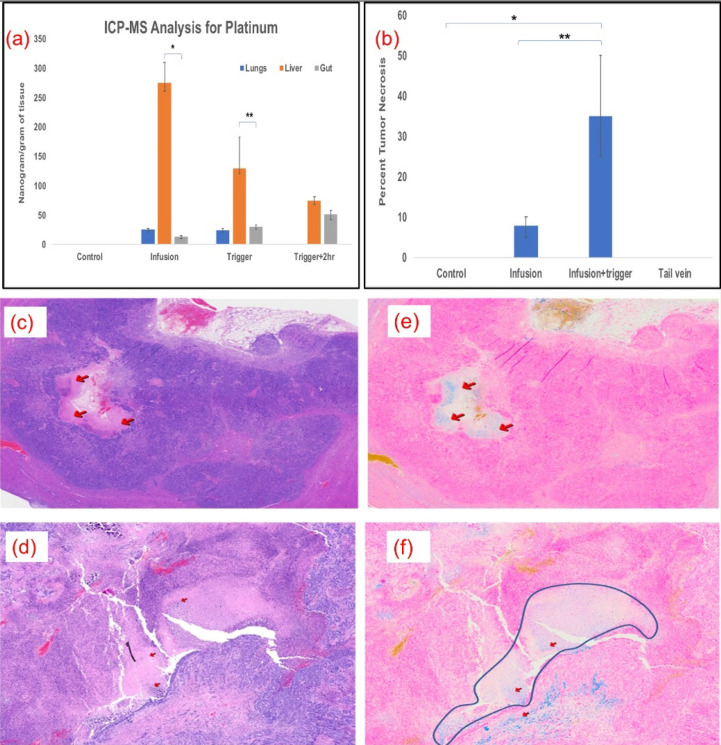
Figure 5.
(a) Significantly higher levels of oxaliplatin was delivered to the liver and remained there compared to the lungs (p<0.001) and intestines (p<0.001); n=5 in each group. (b) Plot shows significant necrotic zones in infusion+ Trigger group (p<0.01). Arrows indicate the necrotic region in H&E staining (c & d) and Fe deposition with Prussian blue staining (e & f) (200X). Outline demonstrates necrotic regions in the field in infused and triggered animals, which serves as the surrogate for treatment efficacy.

