Figure 5.
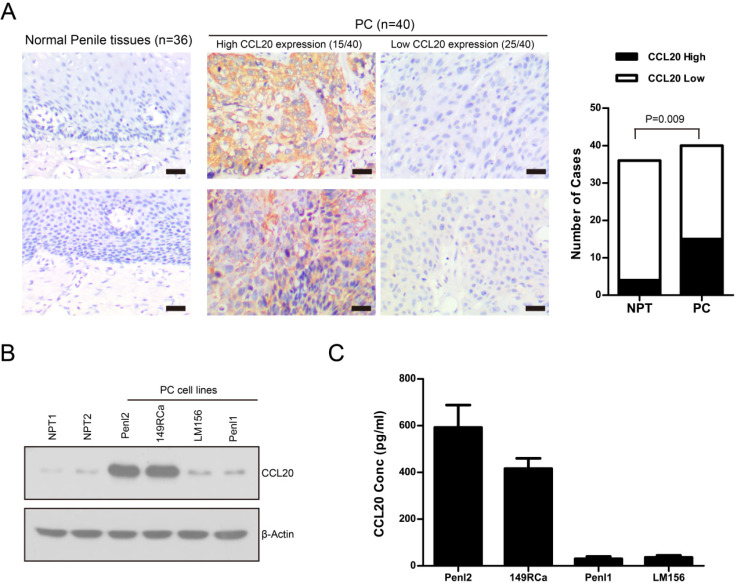
A. Expression of CCL20 in normal penile tissues (NPT, n=36) and PC tissues (n=40). Representing micrographs showed high or low CCL20 expression in normal penile tissues and PC, respectively. Bars: 50 µm. PC vs. NPT, P=0.009. B. Expression of CCL20 in normal penile tissues (NPT1, NPT2) and PC cell lines. C. CCL20 level in culture supernatant of PC cell lines.

