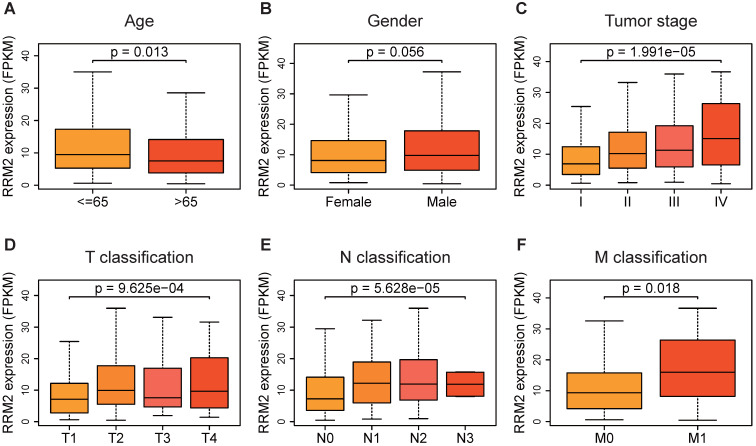
Figure 2.
RRM2 expression in sub-groups of clinical characteristics. (A, B, F) RRM2 expression distribution analyses stratified based on age, gender, and M classification (Wilcoxon test). (C - E) RRM2 expression distribution analyses stratified based on tumor stage and TN classification (Kruskal-Wallis test). P-value < 0.05 was used to assess differences.

