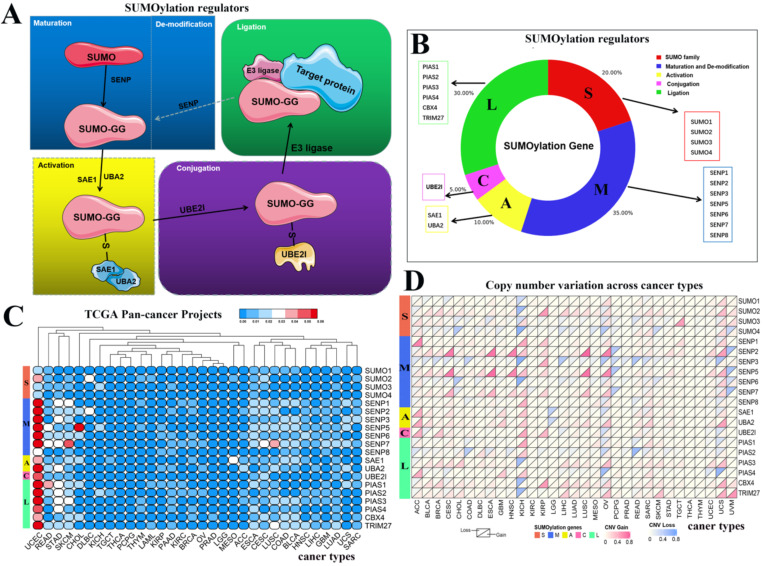
Figure 1.
Schematic diagram of the SUMOylation process and the variation in SUMOylation regulators in pan-cancers. (A) Diagram of SUMOylation regulators. (B) Proportions of SUMO family, Maturation and De-modification, Activation, Conjugation, and Ligation groups among SUMOylation regulators. (C) Mutation frequency of SUMOylation regulators across 33 cancer types. The redder the color, the higher the degree of variation. (D) CNV alteration frequency of SUMOylation regulators across 33 cancer types. The upper part of each grid shows CNV losses, and the bottom part shows CNV gains.

