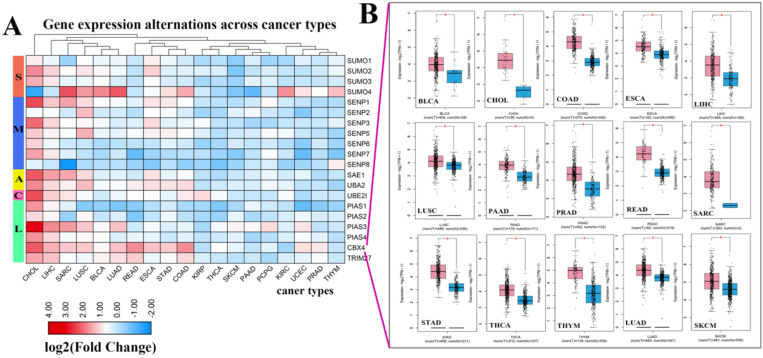
Figure 2.
Expression levels of SUMOylation regulators in various tumors. (A) Gene expression alterations of SUMOylation regulators across 19 cancer types. The heat map shows the fold change, with blue representing down-regulated genes, and red representing up-regulated genes. (B) Box plots showing the expression of CBX4 between 15 types of cancer samples and their corresponding normal samples. Red represents tumor tissue and blue represents normal tissue. *P < 0.05.

