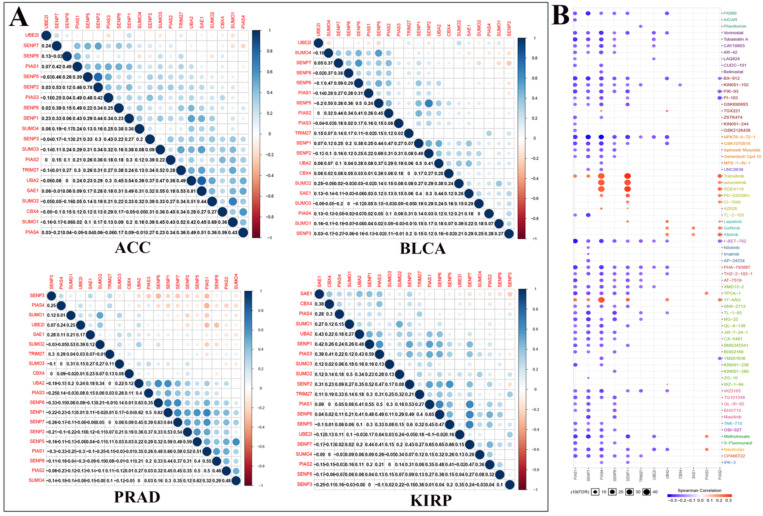
Figure 4.
Co-expression of SUMOylation regulators in four tumors and drug sensitivity analysis. (A) Co-expression of SUMOylation regulators in ACC, BLCA, PRAD, and KIRP. The upper part of the picture shows that the circles between the two molecules are closer to blue in color, indicating that the positive correlation between them is more reliable; the circles between the two units are closer to red in color, meaning that the negative relationship between them is more reliable. The lower part of the picture shows the quantitative value of the relationship between the two molecules. The closer the value is to 1, the stronger the positive correlation; the closer the value is to -1, the stronger the negative correlation. (B) Schematic diagram of the sensitivity between the SUMOylation regulators and various anticancer drugs. The color represents the Spearman correlation, and the size represents the strength of drug targeting.

