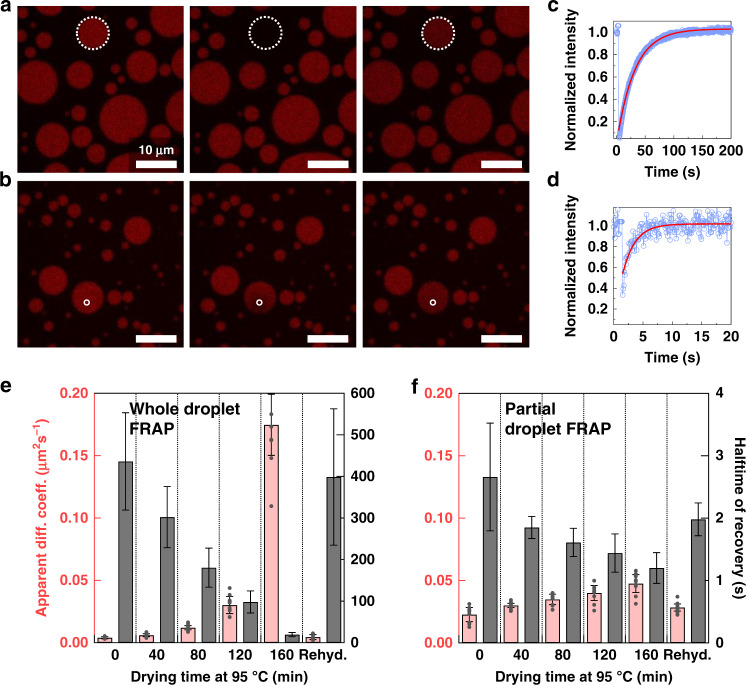
Fig. 3. Dynamics of U15 in the complex coacervate during drying.
a Fluorescence recovery after photobleaching, FRAP, over a whole 1:1 PDADMA:PAA coacervate droplet in solutions dried at 95 °C for 160 min and allowed to return to room temperature before partitioning Alexa 647-U15 within. b FRAP over part of the same coacervate in solutions dried at the same temperature for 80 min and allowed to return to room temperature before adding U15. c Recovery of the fluorescence after whole-droplet photobleaching of U15 partitioned within a coacervate in mixtures allowed to dry for 160 min. d Recovery of the fluorescence after partial-droplet photobleaching of U15 partitioned within a coacervate in mixtures allowed to dry for 80 min. Circle markers represent corrected fluorescence intensity in c, d. Lines are fitting results according to equations mentioned in the Methods section. e Apparent diffusion coefficients and recovery halftimes of U15 as it recovers after bleaching of whole coacervate droplets at each time point of the drying experiment. f Apparent diffusion coefficient and recovery halftimes of U15 as it recovers after bleaching of partial droplets at each time point. The bars are averages of five trials with at least two droplets each in e. In f, the bars are averages of three trials with at least three droplets analyzed in each. All individual data points are shown in Supplementary Tables 2 and 3, and as gray markers for the apparent diffusion coefficients in e and f. The error bars represent the standard deviations among all trials.

