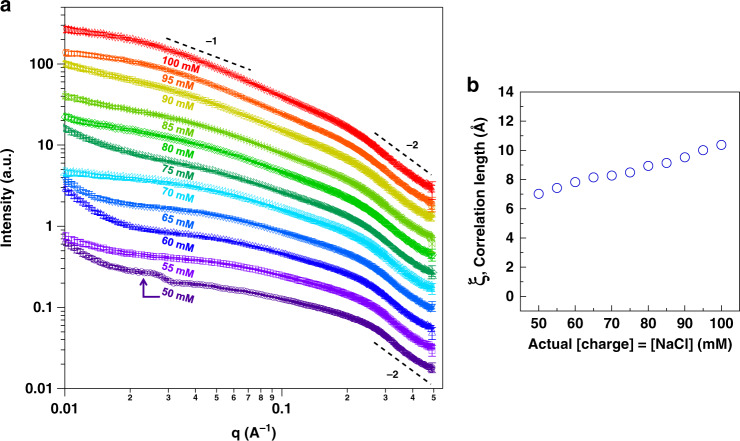
Fig. 6. SAXS data of complex coacervate mimics samples.
a Small-angle X-ray scattering plots of PDADMA/PAA complex coacervate samples prepared at 50–100 mM polymer charge and NaCl, with HEPES ranging between 25 and 50 mM, and MgCl2 between 4.3 and 8.6 mM for the same samples. The data were shifted vertically for clarity (Supplementary Fig. 26a shows the data without vertical shift). Error bars represent noise in the scattering measurements. b Correlation length, ξ, obtained from the Unified fit in the high-q region of the SAXS plots. The individual fits are shown in Supplementary Fig. 26b. Error bars obtained from fits were smaller than the markers and were not included. Their values can be found in Supplementary Table 11.

