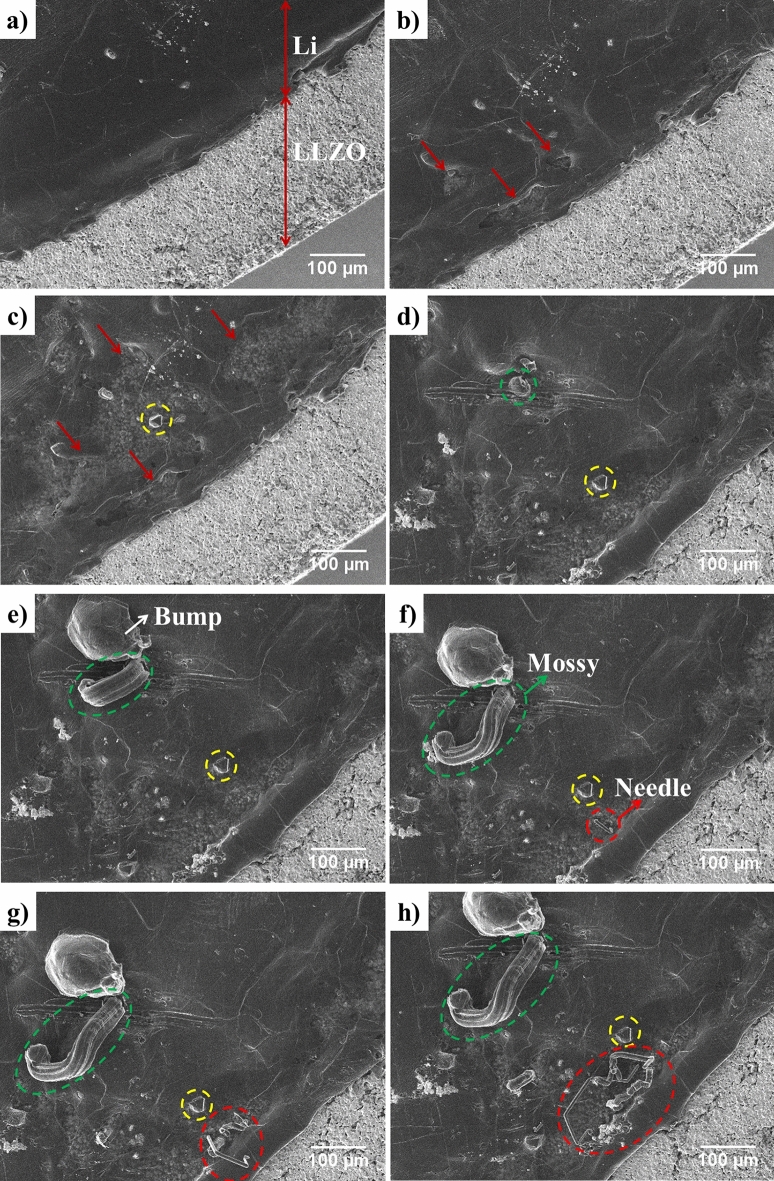
Figure 1.
Obtained cell SEM images corresponding to Video S1; (a) Li and LLZO (at − 0.0036 V and − 7.5 µA cm−2) at the beginning of cycling; (b) beginning of Li thinning (at − 0.0057 V and − 7.5 µA cm−2) after 50 h cycling ; (c) further Li thinning and formation of a bump on Li indicated by yellow dotted circle (at − 0.0018 V and + 15 µA cm−2) after 94 h cycling; (d) initiation of the extrusion of mossy dendrite indicated by green dotted circle (at − 0.0022 V and + 15 µA cm−2) after 97 h cycling; (e) further extrusion of mossy dendrite and formation of an adjacent bump morphology (at − 0.0022 V and + 15 µA cm−2) after 110 h cycling; (f) mossy dendrite and initiation of needle dendrite formation indicated by red dotted circle (at − 0.0022 V and + 15 µA cm−2) after 119 h cycling; (g) further growth of mossy and needle dendrites (at − 0.0034 V and + 15 µA cm−2) after 124 h cycling; (h) mossy and needle dendrites and bump morphology on Li surface (at − 0.0018 V and + 15 µA cm−2) after 128 h cycling. A small shift in images was observed because of specimen drifting during cycling that can be monitored by following the yellow dotted circle.

