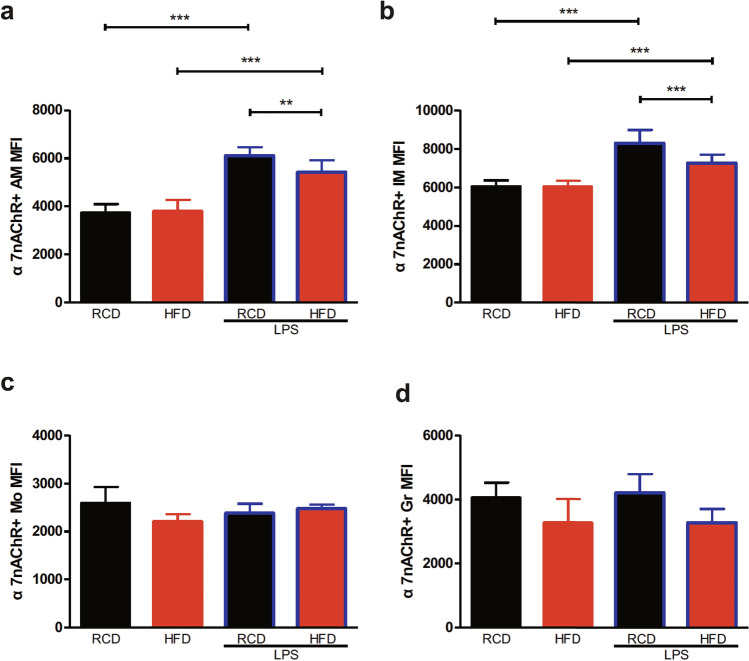
Figure 8.
Changes of α7nAChR expression levels in Lung Cell Populations in Obese Mice. The α7nAChR expression levels of α7nAChR+ alveolar macrophages (a), α7nAChR+ interstitial macrophages (b) were increased after stimulation of LPS. Detailed statistical results can be seen in Supplementary Table S9. RCD group, n = 8; RCD + LPS group, n = 8; HFD group, n = 8; HFD + LPS group, n = 10. α7nAChR+ AM MFI: by ANOVA, post-hoc LSD-t method. P < 0.001, comparing RCD + LPS group to RCD group; P < 0.001, comparing HFD + LPS group to HFD group; P < 0.01, comparing HFD + LPS group to RCD + LPS group. α7nAChR+ IM MFI: by ANOVA after logarithmic transformation, post-hoc LSD-t method. P < 0.001, comparing RCD + LPS group to RCD group; P < 0.001, comparing HFD + LPS group to HFD group; P < 0.001, comparing HFD + LPS group to RCD + LPS group. RCD, regular chow diet. HFD, high-fat diet. LPS, lipopolysaccharide. IM, interstitial macrophages. Mo, monocytes. AM, alveolar macrophages. Gr, Granulocytes. MFI, median fluorescence intensity. Data were presented as Mean ± SD. ***P < 0.001; **P < 0.01.

