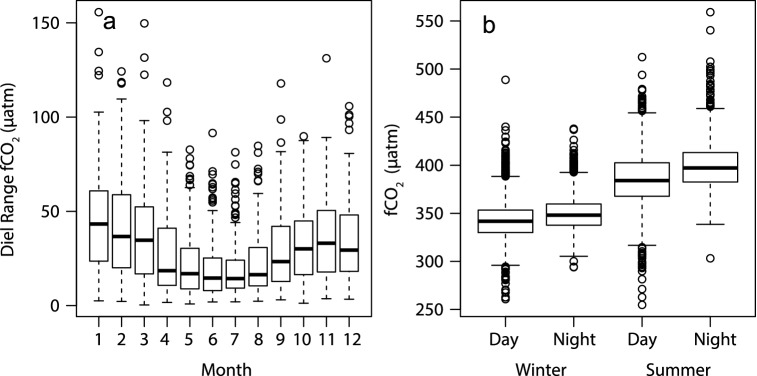
Figure 3.
Diel and seasonal variation in fCO2 at GBRWIS: (a) changes in diel ranges of seawater fCO2 (µatm) across months. (b) Mean fCO2 at day (12:00–16:00 pm) and night (0:00–4:00 am), and in winter (May–Oct) and summer (November–April). Box-whisker plots, with horizontal bars indicating the median, boxes are the 25th–75th percentiles, dashed whiskers are 1.5 interquartile ranges, and circles represent outliers (only data from complete years are included).

