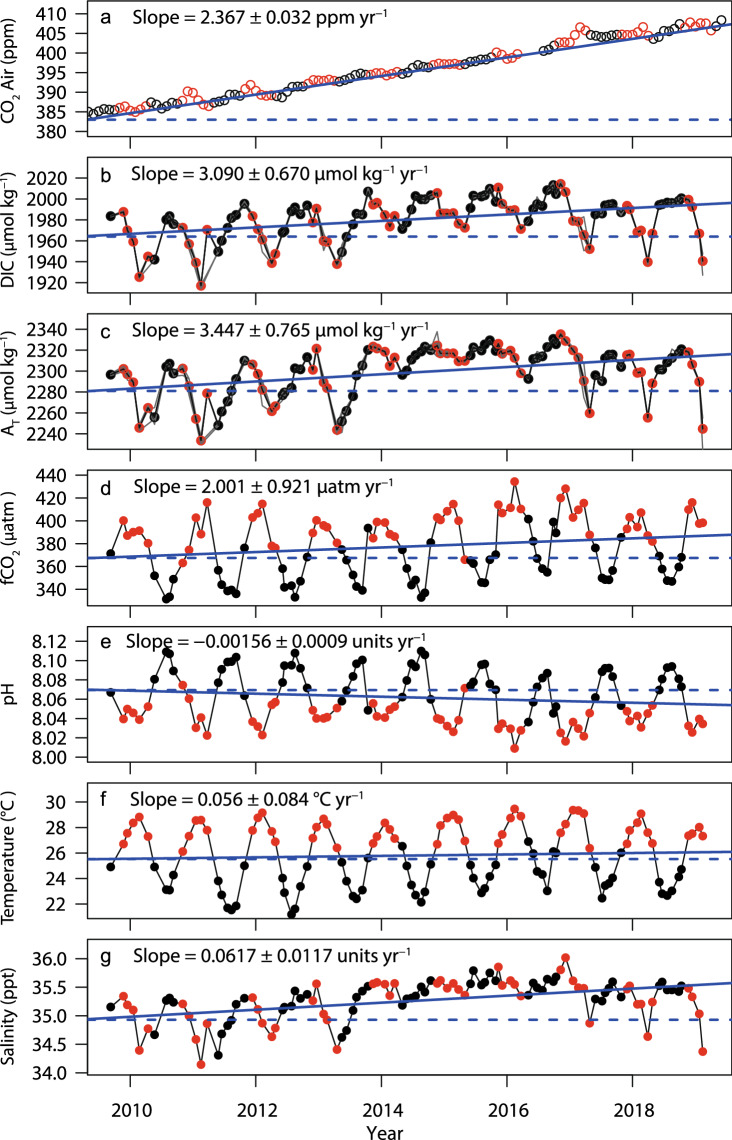
Figure 5.
NRSYON: observed atmospheric CO2 and seawater carbon chemistry values from 2009 to 2019. (a) Atmospheric CO2 concentrations at the Cape Ferguson greenhouse gas monitoring station. (b) To (g): dissolved inorganic carbon (DIC), total alkalinity (AT), temperature and salinity (all measured); fCO2 and pH (calculated). Points are depth-averaged monthly seawater samples; red points indicate summer (November–April); black are winter (May–October). In (b,c), the thin grey lines show the four sampling depths (0, 10, 20, 26 m). Straight solid blue lines are the linear trends, dashed blue lines are horizontal guides. Also shown are slopes of daily averaged data, unadjusted for changes in temperature and salinity.

