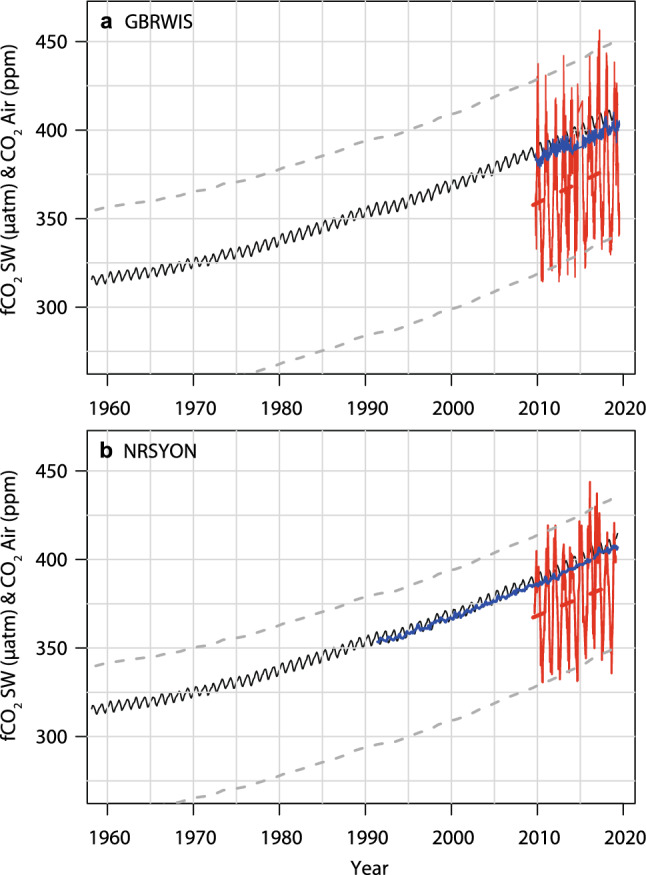
Figure 7.

Observed changes in atmospheric CO2 concentrations at Mauna Loa monitoring station1 (solid black line), and at GBRWIS since 2009 (a, blue line) and Cape Ferguson since 1991 (b, blue line; sourced from https://gaw.kishou.go.jp/search/station#CFA). Red lines: observed seawater fCO2 and their linear fits at GBRWIS (a) and NRSYON (b). Grey dashed lines are back-projections of observed seawater fCO2 envelopes. Also shown are slopes of the data prior to correction for variation in temperature, salinity, seasonality, and nutrients.
