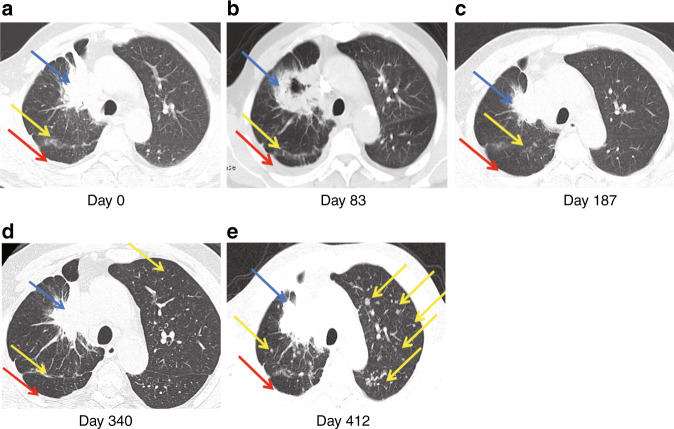
Fig. 5. The CT images of patient P-23 are shown in a–e.
CT imaging scans performed at the start of Icotinib treatment (day 0, 83), at the change of treatment to Icotinib and Apatinib treatment (day 187, 340), and at the change of treatment to TKI and chemotherapy (day 412). Lesions identified in the lung (blue arrow), liver lobe (yellow arrow), and pleura (red arrow) are indicated.

