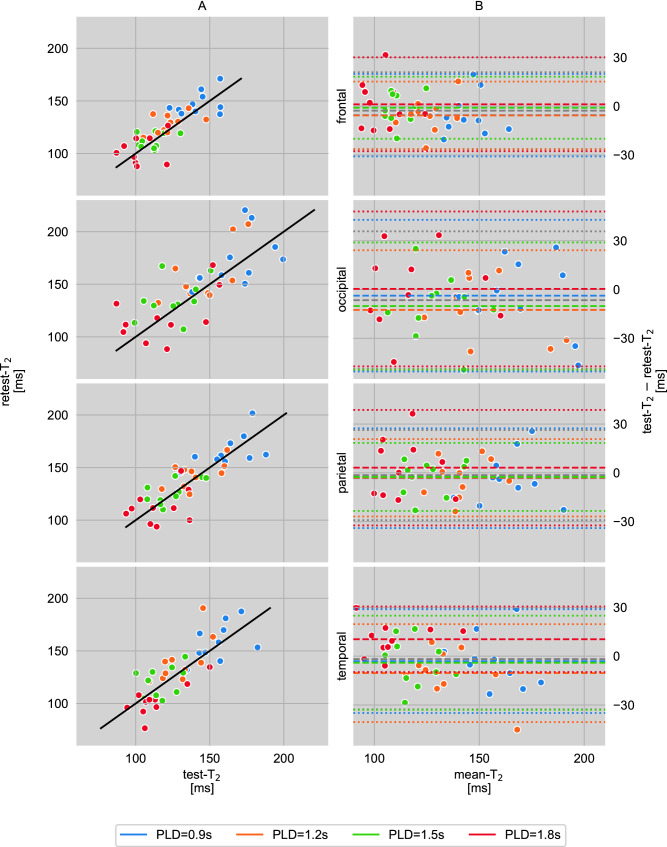
Figure 3.
(A) Correlation of median values from repeated measurements of ten subjects in four gray matter regions of interest (ROIs) at four postlabeling delays PLD = 0.9/1.2/1.5/1.8 s. The solid line is the identity function and represents optimal correlation. (B) Agreement (Bland–Altman plot) between test and retest values which are shown in (A). The mean differences between both scans at each PLD are represented by the dashed lines and dotted lines display the corresponding limits of agreement ( standard deviations of mean differences).

