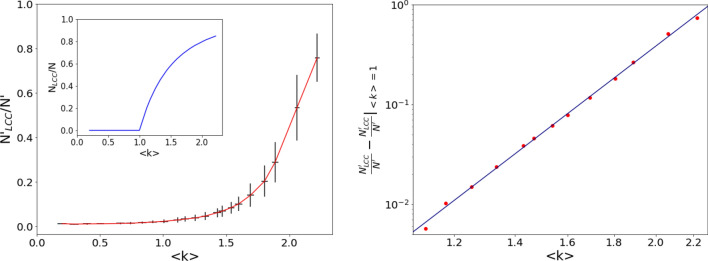
Figure 11.
Left panel: largest connected component (LCC) fraction vs average degree in the sampled subnetworks of the US power grid. Each point corresponds to a fixed subsampling size : the ordinates represent the mean values obtained from realizations and the error bars are the standard deviations of the respective distributions. The inset shows the behavior of the same quantity in the ER network ensemble. Right panel: power-law fit, on a log-log scale, of the LCC fraction for , yielding .

