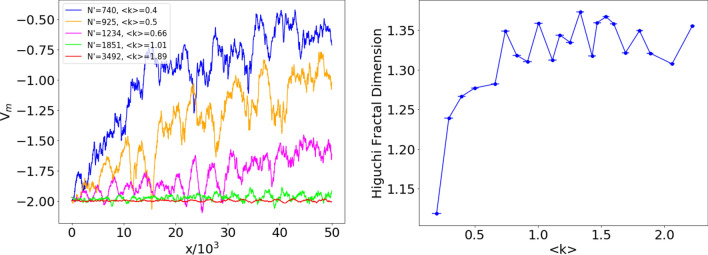
Figure 12.
Left. Pointwise median of the reconstructed potentials of subsamplings of the US power grid with nodes and edges inherited from the original network (). The size of sampled subnetworks ranges from (top) to (bottom). Right. Higuchi fractal dimension of the ensemble potentials on a set of subsamplings of the US power grid network, as a function of the average degree , for . The horizontal coordinates indicate the mean of on the ensemble of subsamplings, while the error bars denote the corresponding standard deviations.

