
Figure 5.
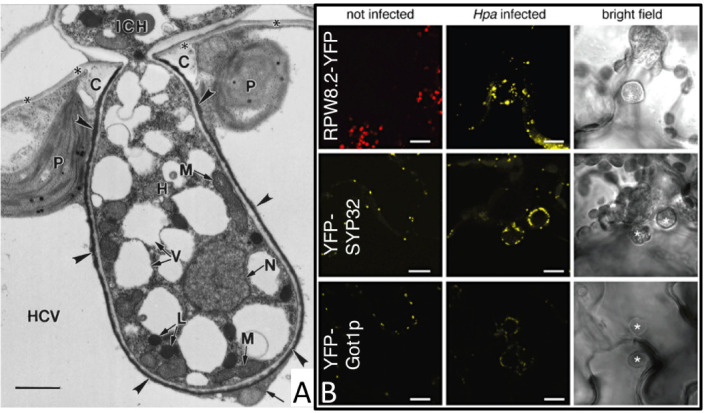
Manipulation of host cell structure and metabolism.
(A) Transmission electron micrograph of fixed Hpa haustoria in leaf cells of At. Near-median longitudinal section of a haustorium (H) showing its continuity with an intercellular hypha (ICH). collar of host cell wall material (C). Host-cell structures: the cell wall (asterisks), plastids (P), the central vacuole (HCV), and cytoplasm (arrow). Pathogen structures: nucleus (N), mitochondria (M), lipid bodies (L), vacuoles (V), and extrahaustorial matrix (arrowheads). Scale bar = 1 μm. Image reproduced from (Mims et al., 2004).
(B) Secretory vesicles differentially localize around Hpa. Confocal micrographs of At transgenic lines expressing the indicated fluorophore fusions show cross-sections of non-infected and Hpa-infected leaves at 3 dpi. Hpa haustoria are shown in bright field images indicated by asterisks. RPW8.2–YFP, YFP–SYP32 and YFP–Got1p are detected in vesicles around Hpa haustoria. Red signals seen in uninfected RPW8.2–YFP leaves are chlorophyll autofluorescence. Bar = 10 μm. Image reproduced from (Lu et al., 2012).