Figure 1.

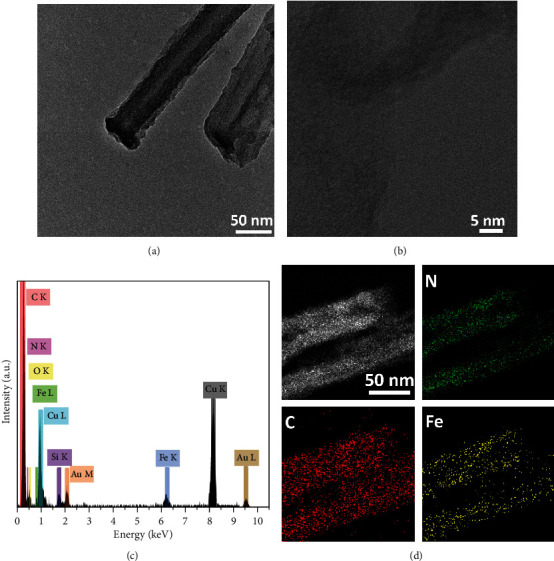
(a) TEM image of Fe-Nx SANs. (b) HRTEM image of the Fe-Nx SANs. (c) EDS elemental analysis of Fe-Nx SANs. (d) STEM image of Fe-Nx SANs and EDS elemental mapping results of C, N, and Fe.

(a) TEM image of Fe-Nx SANs. (b) HRTEM image of the Fe-Nx SANs. (c) EDS elemental analysis of Fe-Nx SANs. (d) STEM image of Fe-Nx SANs and EDS elemental mapping results of C, N, and Fe.