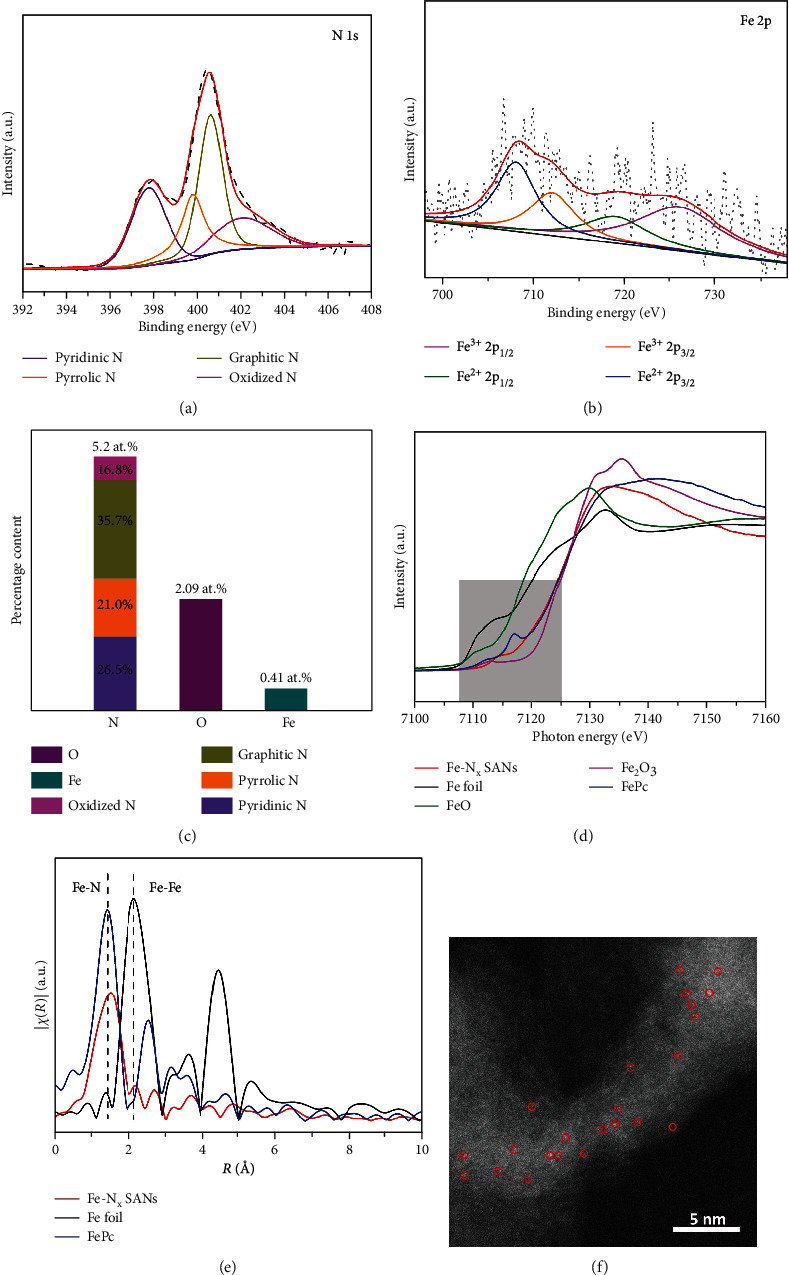
Figure 2.

(a, b) High-resolution N 1 s and Fe 2p spectra of Fe-Nx SANs, respectively. (c) N, O, and Fe contents in Fe-Nx SANs. (d) Fe K-edge XANES spectrum of Fe-Nx SANs and reference samples of FePc, Fe foil, FeO, and Fe2O3. (e) FT k3-weighted EXAFS spectrum of Fe-Nx SANs, FePc, and Fe foil. (f) HAADF-STEM image of Fe-Nx SAN sample.
