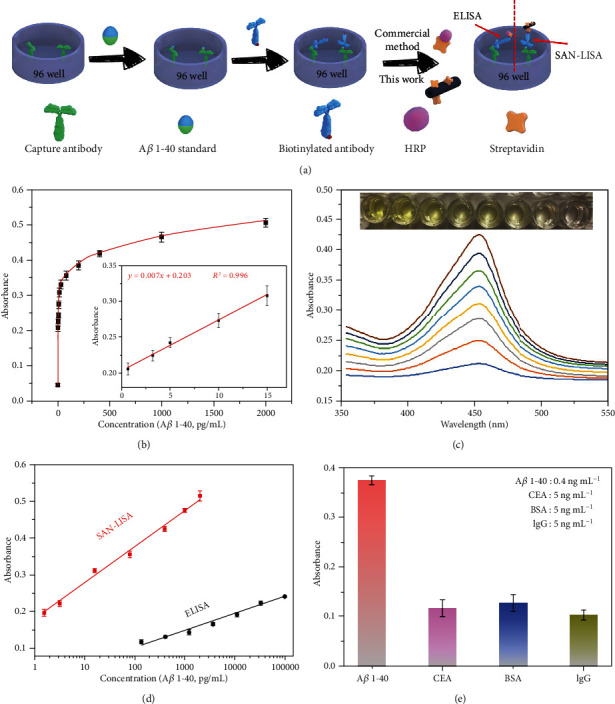
Figure 5.

(a) Schematic illustration of SAN-LISA for the detection of Aβ 1-40. (b) The curve of SAN-LISA for the detection of Aβ 1-40 ranging from 1 pg/mL to 2000 pg/mL. (c) Absorbance spectra of various concentrations of Aβ 1-40 detected by SAN-LISA. (d) Standard curves of SAN-LISA (Aβ 1-40 ranging from 1 to 2000 pg/mL) and ELISA (Aβ 1-40 ranging from 100 pg/mL to 100 ng/mL). (e) Specificity of SAN-LISA (Aβ 1-40 of 400 pg/mL; CEA, BSA and IgG of 5 ng/mL, respectively).
