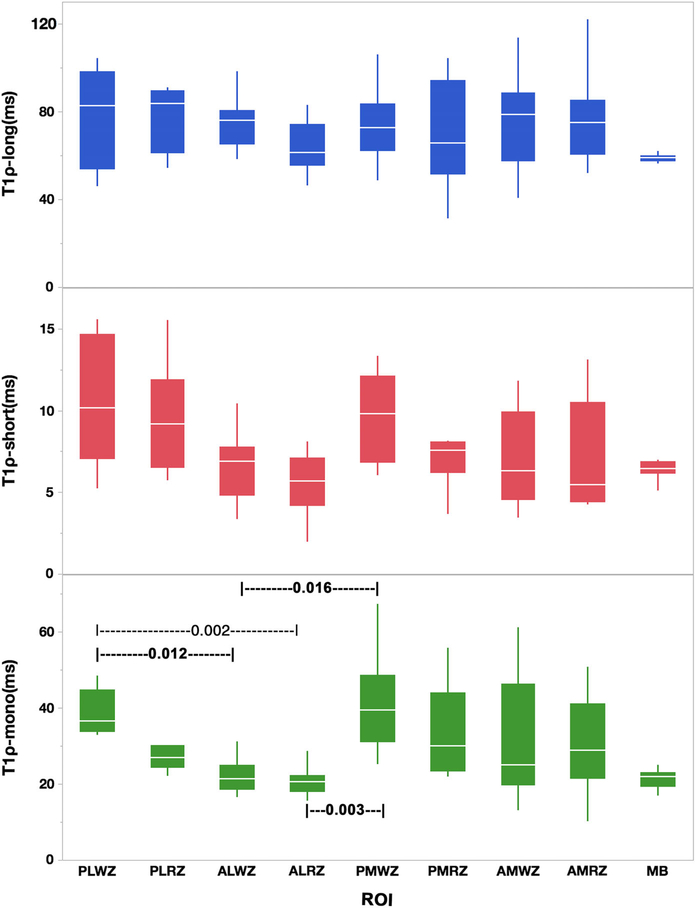
FIGURE 6:
The boxplot shows the T1ρ relaxation times component between nine different ROIs. The line in the middle of each box is the median and the bars extending from the boxes are the minimum and maximum values. The dashed line with numbers show the pairwise rank sum test between two ROIs (PLWZ: Posterior-Lateral White Zone; PLRZ: Posterior-Lateral Red Zone; ALWZ: Anterior-Lateral White Zone; ALRZ: Anterior-Lateral Red Zone; TLM: Total Lateral Menisci; PMWZ: Posterior-Medial White Zone; PMRZ: Posterior-Medial Red Zone; AMWZ: Anterior-Medial White Zone; AMRZ: Anterior-Medial Red Zone; TMM: Total Medial Menisci; MB: Meniscus Body).

