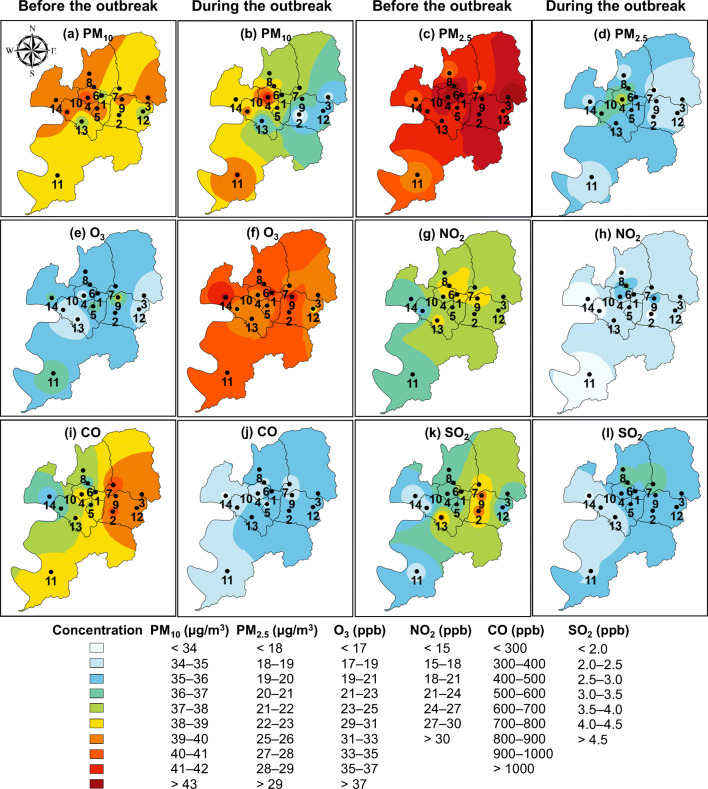
Fig. 5.
Spatial distribution maps of the average CAP concentrations before (January 1–February 17, 2020) and during the COVID-19 pandemic outbreak (February 18–April 30, 2020) in Daegu, South Korea. Contour maps were drawn using ArcGIS 10.8 (ESRI Inc., USA), and inverse distance weighting (IDW) was applied as an interpolation method

