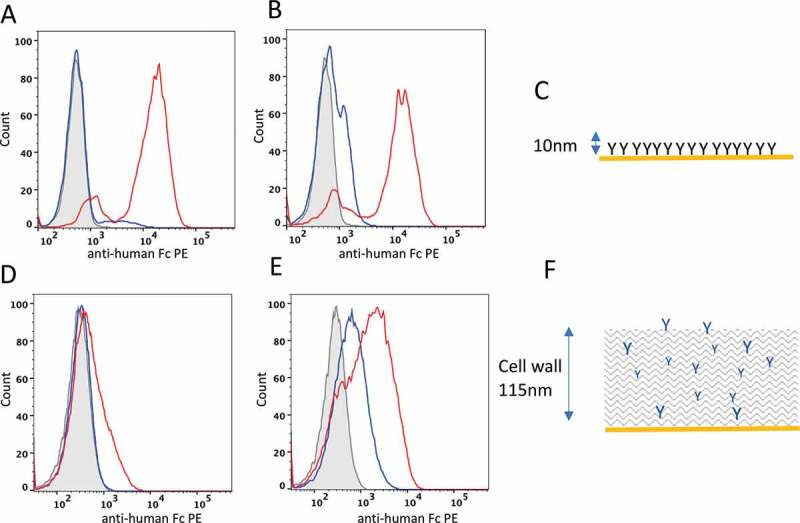
Figure 1.

Distinguishing developable antibody by mammalian cell display. Flow cytometry plots of HEK293 (A and B) and yeast cells (D and E) displaying the Ang2 pair (A and D, respectively) or MEDI-1912 pair (B and E, respectively) on the cell surface. Histogram plots represent the cell count (x-axis) plotted against fluorescence intensity of anti-Fc-PE stain) for non-transfected cells (gray, filled), parental antibody (blue) and improved antibody (red). C and F show a scale representations of antibody presentation by mammalian cell display and yeast display, respectively
