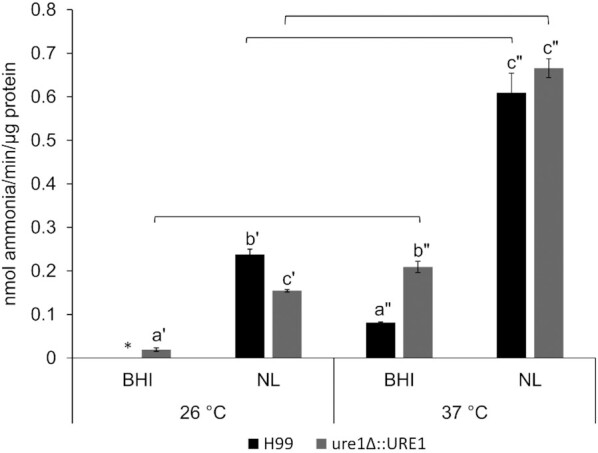
Figure 3.

Urease activities of C. neoformans H99 and ure1Δ::URE1 before (from BHI cultures) and after incubation in a nutrient-limited medium (NL) at 26 and 37°C. Error bars represent the standard error of the mean of three biological repeats. Lettering with the same prime illustrates significant differences between different nutrient conditions at the respective temperatures (P < 0.05). Only letters with the same prime are comparable. Significant differences in urease activity between temperatures, but subjected to the same nutrient condition, are indicated by horizontal lines (P < 0.05). *Absent or below assay detection limit.
