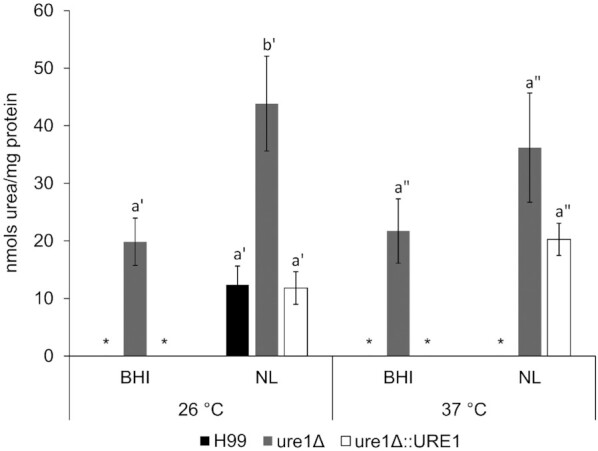
Figure 4.

Urea levels in crude enzyme extracts prepared from C. neoformans H99, ure1Δ and ure1Δ::URE1. Statistical comparisons were performed separately for the different temperatures. Significant differences (P < 0.05) are indicated by lettering and only letters with the same prime are comparable. Bars denote the mean of at least three biological repeats and error bars represent standard error of the mean. *Absent or below assay detection limit.
