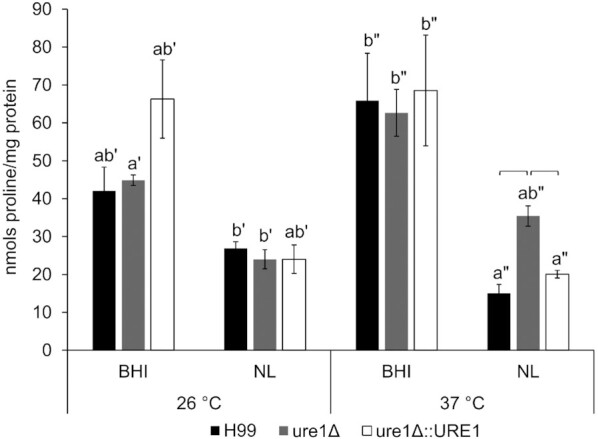
Figure 7.

Intracellular proline levels of H99, ure1Δ and ure1Δ::URE1 strains of C. neoformans exposed to BHI and nutrient-limited (NL) media at 26 and 37°C. Proline content is represented as the nanomoles of proline present per milligram of protein. Bars with error bars represent means with standard error of the mean for at least three biological repeats. Lettering of the same prime denotes significant differences within a temperature treatment (P < 0.05). Short horizontal lines indicate significant differences after exposure to nutrient-limited conditions at 37°C (P < 0.05).
