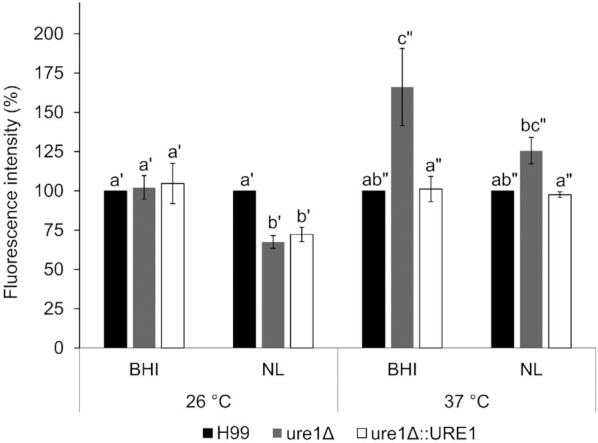
Figure 8.

Fluorescence intensity of cells stained with the ROS indicator dye DCFDA after exposure to BHI and nutrient-limited (NL) media at 26 and 37°C. Results are expressed as the percentage fluorescence intensity relative to wild-type cryptococcal cells. Bars denote the mean of at least three biological repeats and error bars represent standard error of the mean. Statistical analyses were performed separately for the two different temperatures as indicated by letters with the same number of primes (significance set at P < 0.05 in all cases). Results obtained for nutrient-limited conditions at 37°C were also analysed separately for significance, as indicated by brackets (P < 0.05).
