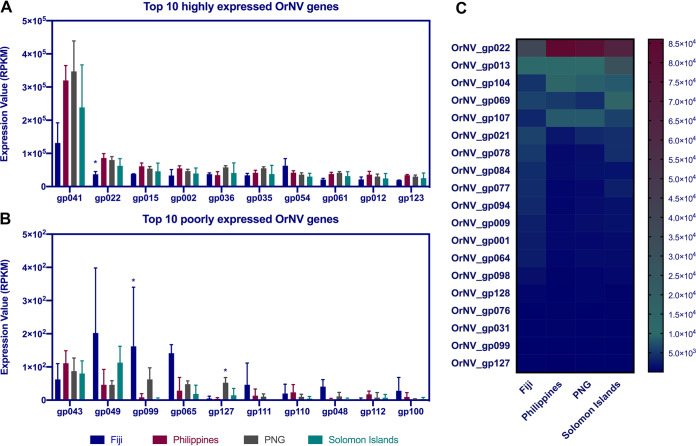
FIG 5.
(A and B) Top 10 highly and poorly expressed OrNV genes in different geographical strains. (C) Only 19 genes are differentially expressed among four OrNV strains. Each column in the heat map corresponds to a geographical region and each row corresponds to a differentially expressed viral gene. TMM normalization was used to make samples comparable, and then a z-score normalization was applied to make the gene expression values comparable.

